June 25th 2019
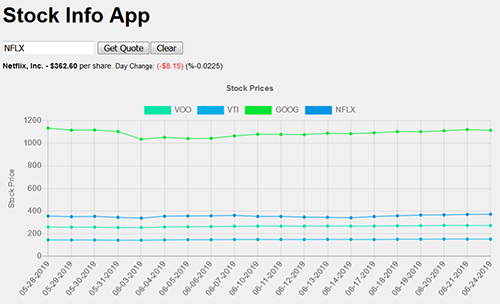
Continued my node/express work. I continued progress and created a ‘stock’ app. I used chart.js to render the stock data (for the past month) to the page. I plan on integrating 5 options (1 day, 1 week, 1 month, 3 months, YTD, and one year) for the user to choose to see.
Here is a screenshot of what I worked on:

Here is that front-end code:
//document elements
var searchInput = document.getElementById('stockSearch');
var searchSubmit = document.getElementById('stockButton');
var stockPrice = document.getElementById('stockPrice');
var dataUl = document.getElementById('data');
var clear = document.getElementById('clear');

//date information
var today = new Date();
var currentDay = today.getUTCDate()+'';
currentDay.length < 2 ? currentDay = 0 + currentDay : currentDay = currentDay;
var currentMonth = today.getUTCMonth()+1+'';
currentMonth.length < 2 ? currentMonth = 0+currentMonth : currentMonth = currentMonth;
var currentYear = today.getUTCFullYear()+'';
var prevYear = today.getUTCFullYear()-1;
var prevMonth = today.getUTCMonth();
var todayString = `${currentYear}-${currentMonth}-${currentDay}`;
var prevYearString = `${prevYear}-${currentMonth}-${currentDay-1}`

//VARIABLES
let currentStockPrice = '';
let daysHistory,weeksHistory,monthsHistory,threeMonthsHistory,yearToDateHistory,yearsHistory;

var ctx, myChart;

//COLORS
const COLORS = ['#00e5a8', '#00afe5', '#00e535','#0095e5', '#6bb9e0'];
var stockCount = 0;

//Chart Styling
Chart.defaults.global.elements.line.borderWidth = 1;
Chart.defaults.global.elements.line.tension = 0;
Chart.defaults.global.elements.point.radius = 2;

function getStockToday(e) {
  if (stockCount >= 5 ) {
    return false;
  }
  let symbol = searchInput.value;
  let url = 'http://localhost:3000/stock?stock=';
// Fetches based only on todays date with the Stock Ticker entered
  fetch(url+symbol).then((response)=> {
    response.json().then((data)=>{
      if (data.error) {
      stockPrice.innerHTML = `<span class="neg">"${symbol}" does not exist, please try another search.</span>`
      } else {
        let changeInPrice = (Number(data.data.price) - Number(data.data.price_open)).toFixed(2);
        let percentIncOrDec = (changeInPrice / Number(data.data.price)).toFixed(4);
        if (changeInPrice > 0) {
          changeInPrice = `<span class="pos">+ $${changeInPrice}</span>`
        } else {
          changeInPrice = `<span class='neg'>(-$${changeInPrice.replace('-','')})</span>`
        }
          stockPrice.innerHTML = `<span class='price'>${data.data.name} -  $${data.data.price}</span> per share. <span class="dayChange">Day Change: </span>${changeInPrice} (%${percentIncOrDec})`
          stockPrice.classList.add('loaded')
        //stockPrice.innerHTML = `<span class='price'>$${data.data.price}</span> per share. <span class="dayChange">Day Change: </span>${changeInPrice} (%${percentIncOrDec})`
      }
    })
  })
}

function getStockHistory(e){
  if (stockCount >= 5 ) {
    stockPrice.innerHTML = '<span class="neg">Only 5 Stock Quotes Allowed. Press "clear" and try again.</span>'
    return false;
  }
  let symbol = searchInput.value;
  let historyUrl = 'http://localhost:3000/stock-history?stock=';
  let dateFrom = `&date_from=${prevYearString}`;
  let dateTo = `&date_to=${todayString}`;
  fetch(historyUrl+symbol+dateFrom+dateTo).then((response)=> {
    response.json().then((data)=>{
      if (data.error) {
        stockPrice.innerHTML = `<span class="neg">"${symbol}" does not exist, please try another search.</span>`
      return console.log(data.error)
      } else {
        let dataHistory = data.data.history
        let dataArray = [];
        for (item in dataHistory) {
          //the if only logging item, it returns the string name not the object at that string
          dataArray.push({date:item,...dataHistory[item]});
        }
        yearsHistory = dataArray;

        yearToDateHistory = dataArray.filter((item) => {
          let firstOfYear = new Date("2019-01-01");
          return new Date(item.date) >= firstOfYear;
        })

        threeMonthsHistory = dataArray.filter((item) => {
          let threeMonthsAgo = new Date()
          threeMonthsAgo.setDate(today.getDate()-90)
          return new Date(item.date) >= threeMonthsAgo;
        })

        monthsHistory = dataArray.filter((item) => {
          let oneMonthAgo = new Date();
          oneMonthAgo.setDate(today.getDate()-31);
          return new Date(item.date) >= oneMonthAgo;
        })

        weeksHistory = dataArray.filter((item) => {
          let oneWeekAgo = new Date();
          oneWeekAgo.setDate(today.getDate()-7);
          return new Date(item.date) >= oneWeekAgo;
        })
        //dataUl.innerHTML = renderList(yearToDateHistory);
        //dataUl.classList.add('loaded')

        if (myChart) {
          //removeData(myChart);
          addData(myChart, {
            label: searchInput.value,
            backgroundColor: COLORS[stockCount],
            borderColor: COLORS[stockCount],
            data: monthsHistory.slice(0).reverse().map((element) => {
              return Number(element.close);
            }),
            fill: false,
          });

        } else {
            ctx = document.getElementById('chart')
            myChart = new Chart(ctx, {
          type: 'line',
          data: {
            labels: monthsHistory.slice(0).reverse().map((element)=>{
              return element.date.split('-')[1] + "-" + element.date.split('-')[2] + "-2019";
            }),
            datasets: [{
              label: searchInput.value,
              data: monthsHistory.slice(0).reverse().map((element) => {
                return Number(element.close);
              }),
              borderColor: COLORS[stockCount],
              backgroundColor: COLORS[stockCount],
              fill: false,
            }],
          },
          options: {
            responsive: true,
            title: {
              display: true,
              text: 'Stock Prices'
            },
            tooltips: {
              mode: 'index',
              intersect: false,
            },
            hover: {
              mode: 'nearest',
              intersect: true,
            },
            scales: {
              xAxes: [{
                display: true,
                scaleLabel: {
                  display: true,
                  labelString: 'Time'
                }
              }],
              yAxes: [{
                display: true,
                scaleLabel: {
                  display: true,
                  labelString: 'Stock Price'
                }
              }]
            }
          }
        })
          }

        stockCount++;
      }
    })
  })
}

//HELPER FUNCTIONS
function removeData(chart) {
  chart.data.datasets = [];
  chart.update();
}

function addData(chart,data) {
  chart.data.datasets.push(data);
  chart.update();
}

//EVENT LISTENERS
searchSubmit.addEventListener('click', (e) => {
  getStockToday();
  getStockHistory();
  document.getElementById('chart-container').classList.remove('hide');
});

clear.addEventListener('click', (e) => {
  removeData(myChart);
  document.getElementById('chart-container').classList.add('hide')
})
